
独立站店铺投放榜
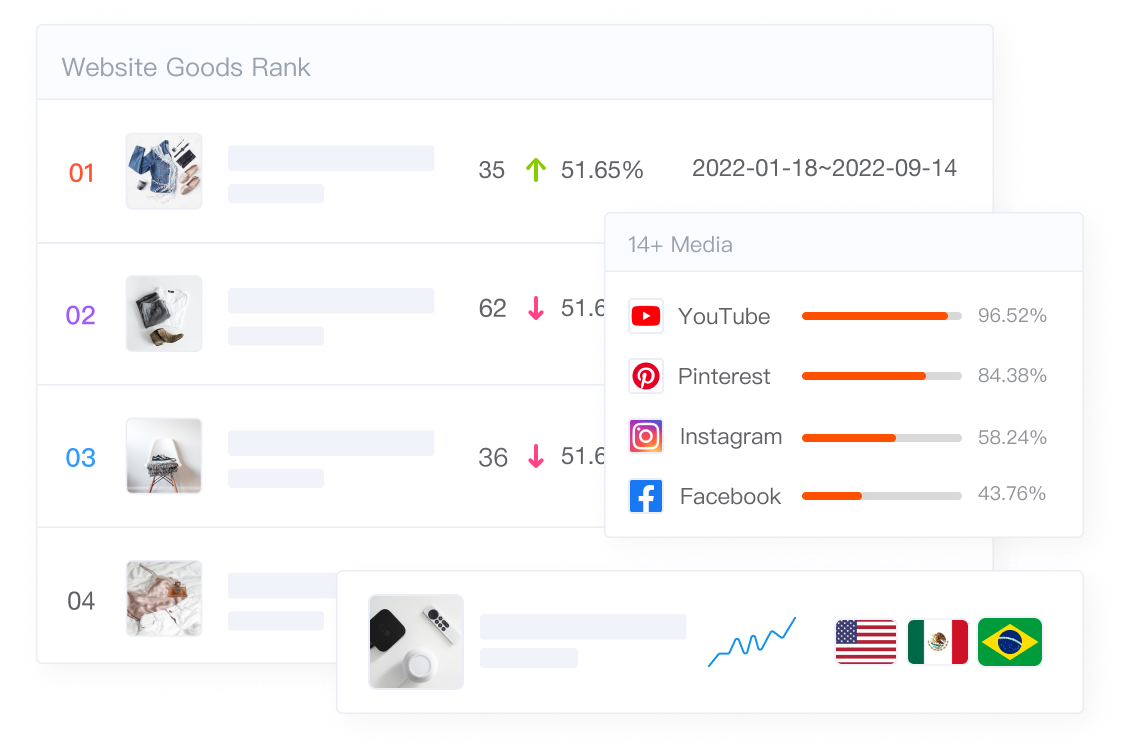
独立站店铺投放排行,掌握一手大卖投放数据
| # | 店铺 | 品类 | 新投放广告数 | 新投放广告数环比变化率 | 在投放广告数 | 在投广告数环比变化率 | |
|---|---|---|---|---|---|---|---|
| 01 | - | 467 | 94.02% | 28,603 | 91.60% | ||
| 02 | 服装 | 185 | 38.33% | 1,571 | 29.07% | ||
| 03 | 家纺布艺 | 59 | 73.53% | 932 | 5.43% | ||
| 04 | 箱包 | 0 | 100.00% | 650 | 2.99% | ||
| 05 | 服装 | 5 | 44.44% | 587 | 49.66% | ||
| 06 | 美妆个护 | 0 | - | 415 | 20.19% | ||
| 07 | 母婴用品 | 28 | 366.67% | 403 | 4.95% | ||
| 08 | - | 0 | - | 343 | 3.11% | ||
| 09 | 珠宝及衍生物 | 6 | 20.00% | 340 | .87% | ||
| 10 | 食品饮料 | 16 | 56.76% | 322 | 2.42% | ||
| 11 | 服装 | 4 | 20.00% | 310 | 46.27% | ||
| 12 | 时尚配件 | 4 | 300.00% | 298 | 49.75% | ||
| 13 | 美妆个护 | 31 | 244.44% | 273 | 11.89% | ||
| 14 | 居家日用 | 2 | 33.33% | 252 | 28.41% | ||
| 15 | 美妆个护 | 8 | - | 234 | 3.31% | ||
| 16 | 珠宝及衍生物 | 5 | 70.59% | 232 | 32.16% | ||
| 17 | 服装 | 11 | 78.85% | 227 | 55.49% | ||
| 18 | 美妆个护 | 0 | 100.00% | 222 | 30.41% | ||
| 19 | 美妆个护 | 1 | 99.45% | 218 | 3.54% | ||
| 20 | 珠宝及衍生物 | 39 | 31.58% | 216 | 9.24% |
